This article is about the Course Event Summary tool. This tool shows you how many users achieved each of the four event types in the courses. (See a detailed description of event types.)
Admins assigned the Reports role can access this tool.
To get to the Course Event Summary tool:
- Go to the Reports section in the admin website
- Go to the Course Event Summary module
Generating a Report
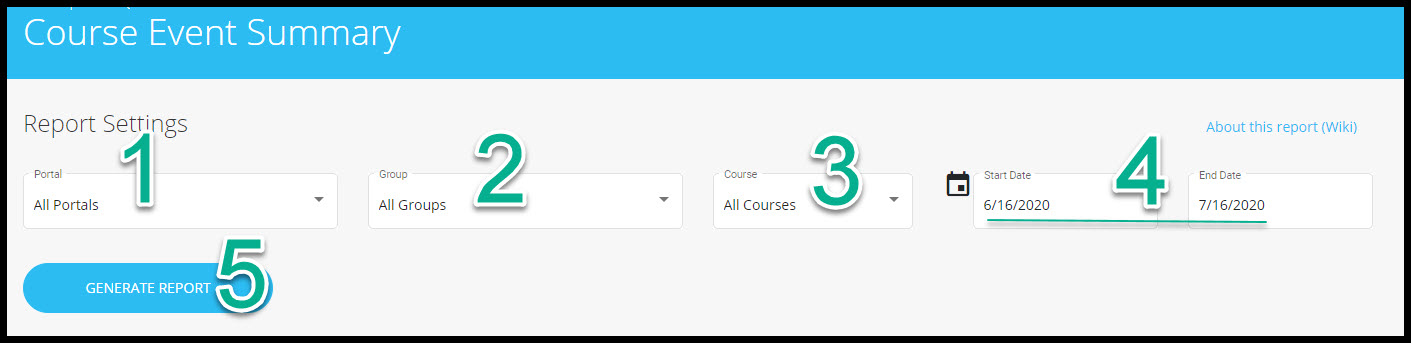
Follow these steps to run a report:
- Choose a specific portal, or all portals, to run the report for by clicking the drop-down arrow in the text-box.
- Choose a specific group, or all groups, to run the report for by clicking the drop-down arrow in the text-box.
- Choose the course, or all courses, to run the report for by clicking the drop-down arrow in the text-box.
- Select a date range by choosing a start date and an end date. This report reflects user activity within this time range. (See more about selecting date-ranges.)
- Click on "Generate Report."
Understanding the Reports
The Bar Graph
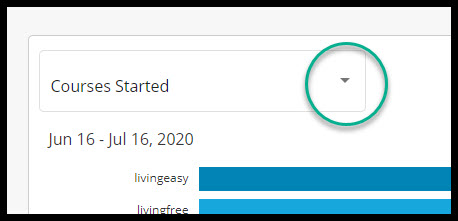
The bar graph shows results for each event individually. Use the drop-down box above the graph allows you to choose which event you want to look at. To change the event, simply click the arrow in the drop-down box:
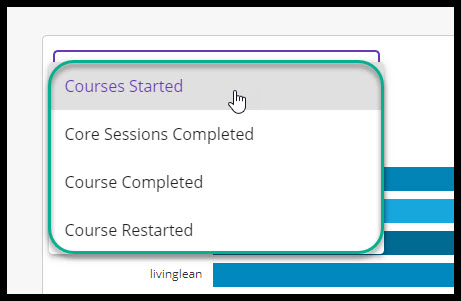
All four events will appear in the drop-down and you can choose which event you want to view:
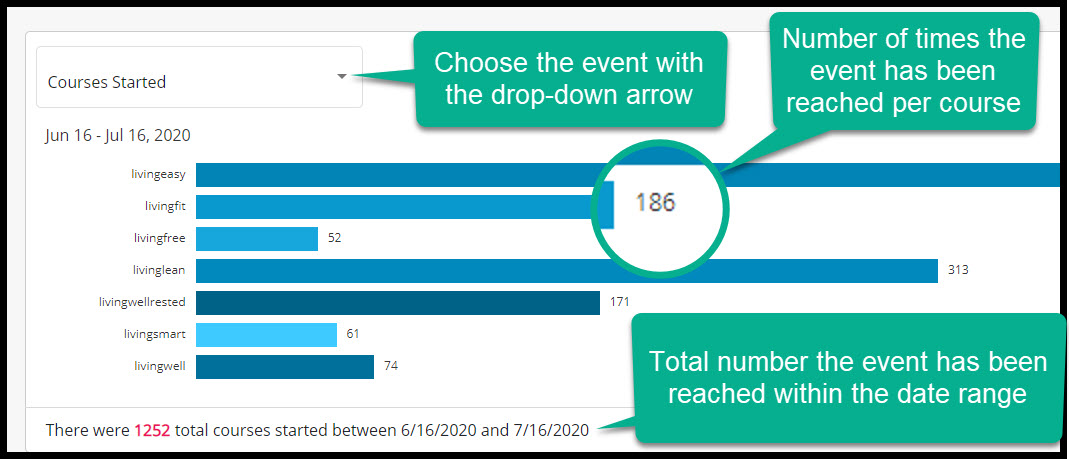
After you choose the event, the bar graph is generated. This horizontal graph displays the number of times the chosen event has been reached for each course during the date-range you selected. Remember: to change events, simply choose a new one from the drop-down and a new graph will load.
Learn more about downloading reports.
The Table
Beneath the bar graph is a table that shows how many times all events were achieved for the portal(s) selected. The table reports the portal as a whole and then, beneath it, the group breakdown.
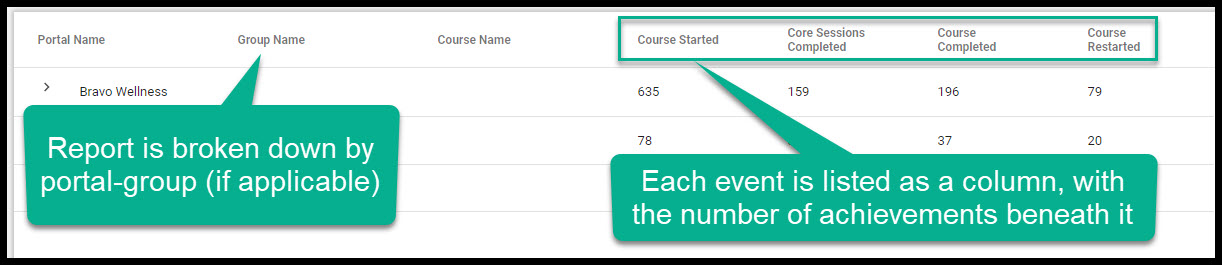
The column-order in the table can be changed by dragging and dropping the columns to where you want them. Learn more about table functionality.
Was this article helpful?
That’s Great!
Thank you for your feedback
Sorry! We couldn't be helpful
Thank you for your feedback
Feedback sent
We appreciate your effort and will try to fix the article